What is probability — the definition and scale
Probability measures how likely an event is to happen, expressed as a number between 0 and 1 (inclusive).
- 0 means the event is impossible (it will definitely not happen).
- 1 means the event is certain (it will definitely happen).
- 0.5 means the event is equally likely to happen or not happen.
It can also be expressed as a percentage (0 to 100%) or as a fraction (0 to 1).
The basic formula is:
P(event) = number of favourable outcomes ÷ total number of possible outcomes
Example
What is the probability of rolling a 4 on a standard six-sided die?
- Favourable outcomes: 1 (only one face shows a 4)
- Total possible outcomes: 6 (the die has six faces)
- P(rolling a 4) = 1/6 ≈ 0.167 ≈ 16.7%
This applies when all outcomes are equally likely — a fair die, an unbiased coin, a well-shuffled deck.
What is probability telling us? It is not predicting the future for certain. It is quantifying how often we would expect an event to occur if we repeated the situation many times. Roll a fair die 600 times and expect to roll a 4 roughly 100 times — not exactly, but approximately.

Key probability concepts — complementary and combined events
Complementary events
The chance of an event NOT happening is called the complementary probability:
P(not A) = 1 − P(A)
If the chance of rain tomorrow is 0.3 (30%), the chance of no rain is 0.7 (70%). These always sum to 1.
Independent events
Two events are independent if the outcome of one does not affect the other. Flipping a coin and rolling a die are independent.
For independent events: P(A and B) = P(A) × P(B)
Example: chance of flipping heads AND rolling a 6 = ½ × ⅙ = 1/12.
Mutually exclusive events
Two events are mutually exclusive if they cannot both happen at the same time. Rolling a 3 and rolling a 5 on the same die roll are mutually exclusive.
For mutually exclusive events: P(A or B) = P(A) + P(B)
P(rolling a 3 or a 5) = ⅙ + ⅙ = 2/6 = ⅓.
Experimental vs theoretical probability
Theoretical probability is calculated from the known structure of a situation (e.g., a fair die has 6 equal faces).
Experimental probability is calculated from actual results. If you flip a coin 100 times and get 48 heads, the observed frequency is 48/100 = 0.48. The more trials you run, the closer results tend to get to the theoretical value — this is the Law of Large Numbers.

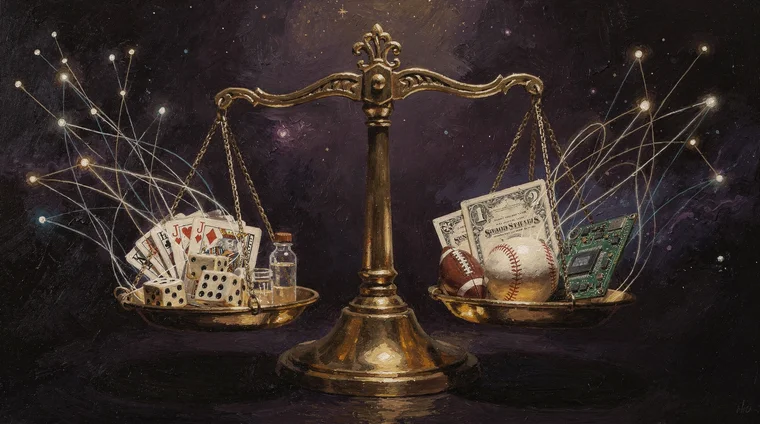
Why probability matters — real-world applications
It is one of the most practically useful areas of mathematics. It underpins fields as diverse as medicine, finance, sport, and technology.
Medicine and health
Clinical trials use statistical methods to determine whether a new drug is effective. Doctors use these methods to interpret test results — a positive test does not mean you definitely have a disease; it means the likelihood of having it has increased. Understanding this prevents both unnecessary panic and false reassurance.
Weather forecasting
When a forecast says "70% chance of rain", meteorologists mean that in situations with these atmospheric conditions, rain has occurred about 70% of the time historically. It is a statistical statement based on data patterns, not a guarantee.
Insurance and finance
Insurance companies use this science to calculate premiums. If the chance of a house fire in a given year is 0.001 (0.1%), they price the policy to cover expected claims across thousands of customers. Investment models use the same approach to estimate risk and expected returns.
Everyday decisions
From deciding whether to carry an umbrella to evaluating the fine print on a competition entry, probability reasoning helps people make better-informed choices.
For parents, playing simple probability games with cards, dice, or spinners is one of the best ways to build intuition for chance — the For parents guide has suggestions for maths games at home.
Frequently asked questions
- Can probability be greater than 1?
- No. Values always range from 0 (impossible) to 1 (certain). A probability greater than 1 is mathematically impossible. If a calculation gives a probability above 1 or below 0, it indicates an error in the working.
- What is the difference between probability and statistics?
- Probability starts from a known model and predicts what data should look like (e.g., a fair coin should land heads half the time). Statistics works in the opposite direction — it starts from data and tries to infer what model or parameters might explain it. The two fields are deeply connected and taught together in school.
- Why does flipping heads ten times in a row not make the next flip more likely to be tails?
- This common misconception is called the gambler's fallacy. Each flip is independent — the coin has no memory. The chance of heads on the eleventh flip is 0.5, regardless of what happened before. The chance of ten heads in a row is very low (1/1024) — but once it has happened, it has no influence on the next flip.
- At what age do students learn probability at school?
- Most curricula introduce basic probability language (certain, possible, unlikely, impossible) around age 9–11 (grades 4–5). Calculating probability using the formula — favourable outcomes divided by total outcomes — typically starts at age 11–13 (grades 6–7). Combined events, tree diagrams, and more advanced topics are introduced in grades 8–10.